College graduate retention

About this Indicator

This indicator shows the percentage of employed college graduates working in the state of their graduating institution 1, 5, or 10 years after completing a postsecondary credential. It includes graduates of certificate, associate degree, and bachelor's degree programs, regardless of whether they were in-state or out-of-state residents at the time of initial enrollment. Employment status is determined using quarterly earnings reported in state unemployment insurance (UI) wage records. To be considered employed, an individual must have positive earnings during the measured time period, reflecting active participation in the workforce. However, the indicator does not capture all forms of employment due to the nature of state UI systems. Individuals who are self-employed, independent contractors, federal employees, elected officials, or others not covered by state UI systems are excluded because their earnings are not reported in these records.

Participation in the Postsecondary Employment Outcomes (PSEO) data collection is voluntary, and the scope and comprehensiveness of the data currently varies significantly across states. Some states such as Minnesota provide data that include graduates from most higher education institutions and across all credential types, while others such as South Dakota contribute data from a subset of institutions or credentials. Consequently, comparisons between states should account for differences in data representation.  

Data Source

U.S. Census Bureau. Postsecondary Employment Outcomes (PSEO) public-use data.

Note. Cohort years represent the range of years in which individuals completed their postsecondary credential. For example, the 2013-2015 cohort includes college graduates from 2013, 2014, and 2015. Ten-year retention outcomes are only available for graduates from 2006 to 2010. 

The list below shows the participating data partners and the percentage of graduates represented in each state. The percentage of graduates represented is based on the number of graduates in the 2015 PSEO data year relative to all public and private graduates from 2015 IPEDS Completions Data.

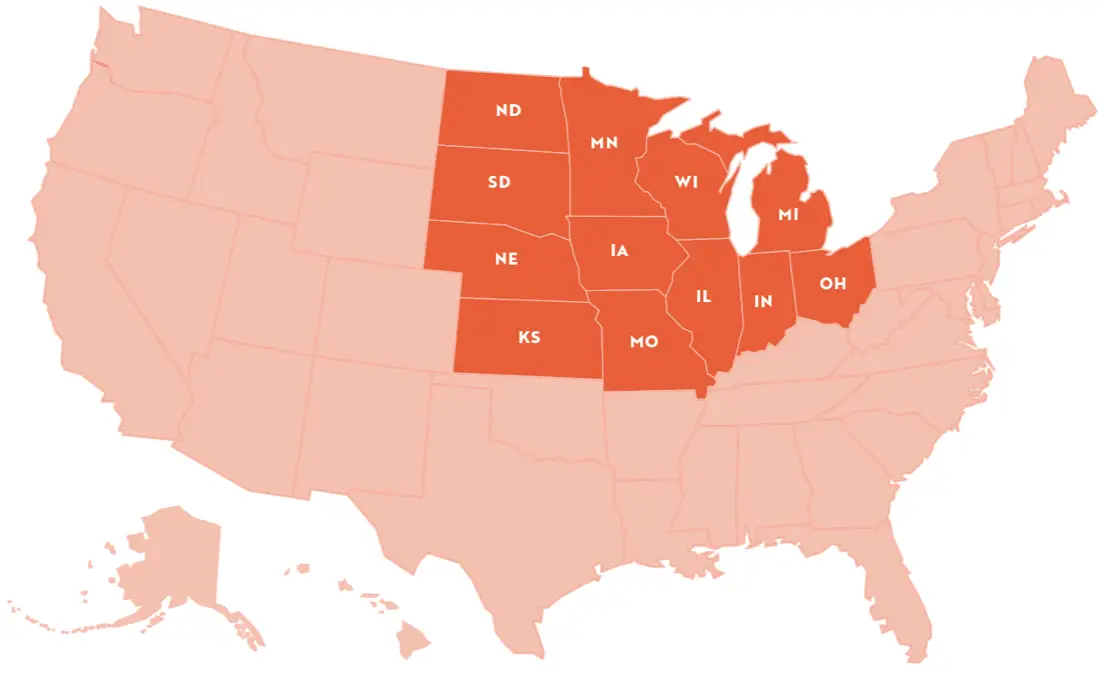
Accordingly, the Midwest percentages reflect graduates from participating institutions in 9 of the 12 Midwest states: Illinois, Indiana, Iowa, Michigan, Minnesota, Missouri, Ohio, South Dakota, and Wisconsin. The U.S. percentages reflect data from participating institutions in 30 states. The U.S. and Midwest benchmarks include college graduates from both public and private institutions.

Data Partners and Graduate Coverage by State (U.S. Census Bureau, 2025)

  • Alabama (University of Alabama System) - 21% 

  • Alaska (No Participating Institutions) 

  • Arizona (Arizona Board of Regents) - 25% 

  • Arkansas (No Participating Institutions) 

  • California (No Participating Institutions) 

  • Colorado (Colorado Department of Higher Education) - 72% 

  • Connecticut (Connecticut Conference of Independent Colleges; Connecticut State Colleges and Universities; University of Connecticut) - 69% 

  • Delaware (No Participating Institutions) 

  • Florida (No Participating Institutions) 

  • Georgia (Georgia Independent College Association; University System of Georgia) - 43% 

  • Hawaii (University of Hawaii System) - 72% 

  • Idaho (No Participating Institutions) 

  • Illinois (Illinois Board of Higher Education; Illinois Community College Board) - 69% 

  • Indiana (Indiana Commission for Higher Education) - 77% 

  • Iowa (Iowa Board of Regents; Iowa Department of Education) - 66% 

  • Kansas (No Participating Institutions) 

  • Kentucky (No Participating Institutions) 

  • Louisiana (Louisiana Board of Regents) - 74% 

  • Maine (Maine Community College System; University of Maine System) - 54% 

  • Maryland (No Participating Institutions) 

  • Massachusetts (Massachusetts Department of Higher Education) - 32% 

  • Michigan (Institute for Research on Innovation and Science—University of Michigan - Ann Arbor) - 10% 

  • Minnesota (Minnesota Office of Higher Education) - 95% (Estimate provided by the Minnesota Office of Higher Education.) 

  • Mississippi (No Participating Institutions) 

  • Missouri (Missouri Department of Higher Education and Workforce Development) - 50% 

  • Montana (Montana University System) - 83% 

  • Nebraska (No Participating Institutions) 

  • Nevada (No Participating Institutions) 

  • New Hampshire (No Participating Institutions) 

  • New Jersey (No Participating Institutions) 

  • New Mexico (No Participating Institutions) 

  • New York (The City University of New York; The State University of New York) - 44% 

  • North Carolina (No Participating Institutions) 

  • North Dakota (No Participating Institutions) 

  • Ohio (Ohio Department of Higher Education) - 61% 

  • Oklahoma (Oklahoma State Regents for Higher Education) - 66% 

  • Oregon (Oregon Higher Education Coordinating Commission) - 70% 

  • Pennsylvania (The Pennsylvania State University) - 11% 

  • Rhode Island (Bryant University) - 4% 

  • South Carolina (South Carolina Commission on Higher Education) - 86% 

  • South Dakota (South Dakota Board of Technical Education) - 22% 

  • Tennessee (No Participating Institutions) 

  • Texas (Texas Higher Education Coordinating Board; University of Texas System) - 77% 

  • Utah (Utah System of Higher Education) - 73% 

  • Vermont (No Participating Institutions) 

  • Virginia (State Council of Higher Education for Virginia) - 87% 

  • Washington (No Participating Institutions) 

  • West Virginia (West Virginia Higher Education Policy Commission) - 43% 

  • Wisconsin (Institute for Research on Innovation and Science—University of Wisconsin - Madison; University of Wisconsin System) - 45% 

  • Wyoming (Wyoming Community College Commission) - 48% 

Source. U.S. Census Bureau. (2025). Post-Secondary Employment Outcomes (PSEO). Longitudinal Employer-Household Dynamics.