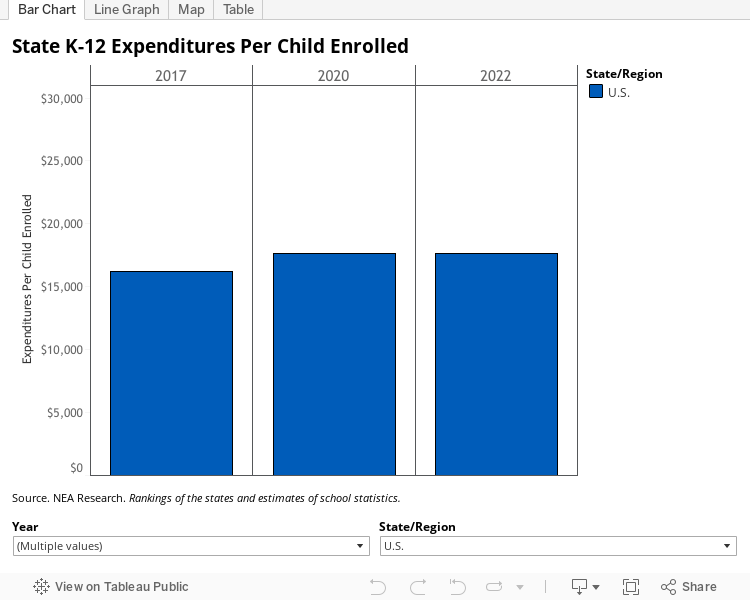
K-12 Expenditures


About this Indicator
This indicator shows the average state K-12 expenditures per child enrolled. Nationally, total expenditures per student increased by six percent from 2009-10 to 2018-19. About 80 percent of current expenditures consist of employee salaries and benefits.1
Data Source
National Education Association. Rankings of the states and estimates of school statistics.
1 National Center for Education Statistics. (2022). Public School Expenditures. Condition of Education. U.S. Department of Education, Institute of Education Sciences. Retrieved from https://nces.ed.gov/programs/coe/indicator/cmb